 by
Houston subsidence is not a history lesson. It is happening right now in some of the fastest-growing suburbs in Texas, and the 2026 reports show exactly where.
In this guide, I break down what happened to Brownwood in Baytown, what the newest Harris-Galveston and Fort Bend Subsidence District reports say, and which areas are sinking fastest. Then I get practical. Specifically, I cover how subsidence should (and should not) change the way you buy or sell a home in Greater Houston.
What Is Houston Subsidence?
Houston subsidence is the slow sinking of the ground caused mostly by pumping too much groundwater. When water is pulled out of the aquifers, layers of clay underground compact like a squeezed sponge. As a result, the land surface drops.
Here is the part buyers need to hear: once the ground sinks, it does not come back up. The Harris-Galveston Subsidence District (HGSD) calls it permanent and irreversible.
Subsidence matters for real estate for three main reasons:
- Flood risk. Lower ground can change how water drains and pools.
- Drainage and foundations. Uneven sinking can tilt lots, streets and drainage lines.
- Fault movement. In the Houston area, subsidence and active fault lines tend to show up together.
What Happened to Brownwood in Baytown?
Brownwood sank roughly 9 to 10 feet from heavy groundwater pumping, flooded again and again, and was abandoned after Hurricane Alicia in 1983. Today, the land is the Baytown Nature Center.
Brownwood was an upscale waterfront subdivision on Galveston Bay, developed starting in the late 1930s. Locals called it the “River Oaks of Baytown.” More than 400 families lived there over the years, including oil executives, doctors and lawyers.
How Brownwood Went Under
Baytown pulled its water from the ground until 1976. Meanwhile, the industrial corridor along the Houston Ship Channel was pumping huge amounts of groundwater too. Consequently, the clay layers under Brownwood compacted and the neighborhood dropped.
Here is the timeline:
- 1940s to 1970s: Most of the sinking happens. HGSD puts the total at more than 9 feet; KPRC 2 reported about 10 feet.
- 1961: Hurricane Carla floods the area. HGSD general manager Mike Turco called it “a wakeup call.”
- 1970s: Residents bring in fill dirt and pumps. Even so, high tide starts leaving parts of the neighborhood underwater.
- 1983: Hurricane Alicia, a Category 3 storm, pushes more than 10 feet of water into Brownwood.
- After Alicia: FEMA declares the area unlivable. Homeowners are bought out and the homes are bulldozed.
- 1994: The City of Baytown opens the Baytown Nature Center on the land.
If you walk the nature center today, you can still see slabs, pipes and even an old pool casing sitting in the water.
Why Brownwood Still Matters
Brownwood is the reason Texas created the Harris-Galveston Subsidence District in 1975. It was the first agency of its kind in the country. Since then, the coast and Ship Channel areas switched to surface water, and subsidence there has largely stopped.
However, the problem did not disappear. Instead, it moved. As Houston grew west and north on groundwater, the sinking followed the growth.
What Do the 2026 Subsidence Reports Show?
The 2026 reports show the coast is stable, but north and west Harris County and northern Fort Bend County are still sinking, with the fastest rates in the Katy and Fulshear area.
Harris-Galveston Subsidence District 2025 Annual Groundwater Report
HGSD presented its 50th Annual Groundwater Report on April 30, 2026, and its board approved it on May 13, 2026. Key findings:
- Groundwater use in Harris and Galveston counties fell 2% to 232.8 million gallons per day.
- Groundwater now supplies about 21% of total water demand.
- About 83% of groundwater pumping happens in Regulatory Area 3, which covers much of north and west Harris County.
- Area 1 (the coast and Ship Channel) is stable with no significant subsidence.
- Area 3 is generally sinking more than 0.5 centimeters per year.
- The highest rate in the district, more than 3 centimeters per year, came from a GPS station in the Katy and Fulshear area.
- Since 1977, aquifer levels in Area 3 dropped more than 300 feet. Near The Woodlands, the drop topped 400 feet.
HGSD tracks this with about 190 GPS stations, plus satellite radar data.
Fort Bend Subsidence District 2025 Annual Groundwater Report
The Fort Bend Subsidence District (FBSD) presented its report on April 30, 2026. Notably, its numbers line up with HGSD:
- Katy/Fulshear: about 15.3 centimeters (6 inches) since 2021, an average of 3.32 centimeters (about 1.3 inches) per year.
- Sugar Land: about 33.1 centimeters (13 inches) since 1994, with slower recent rates.
- Rosenberg: about 9.9 centimeters (3.9 inches) since 1999.
- Water levels: in northern Fort Bend County, including Cinco Ranch, Katy and Fulshear, aquifer levels fell more than 200 feet from 1990 to 2026.
What 3 Centimeters a Year Really Means
Three centimeters sounds tiny. In practice, Turco told KPRC 2 in September 2026 that it works out to “about a foot per decade, or even a little bit more.”
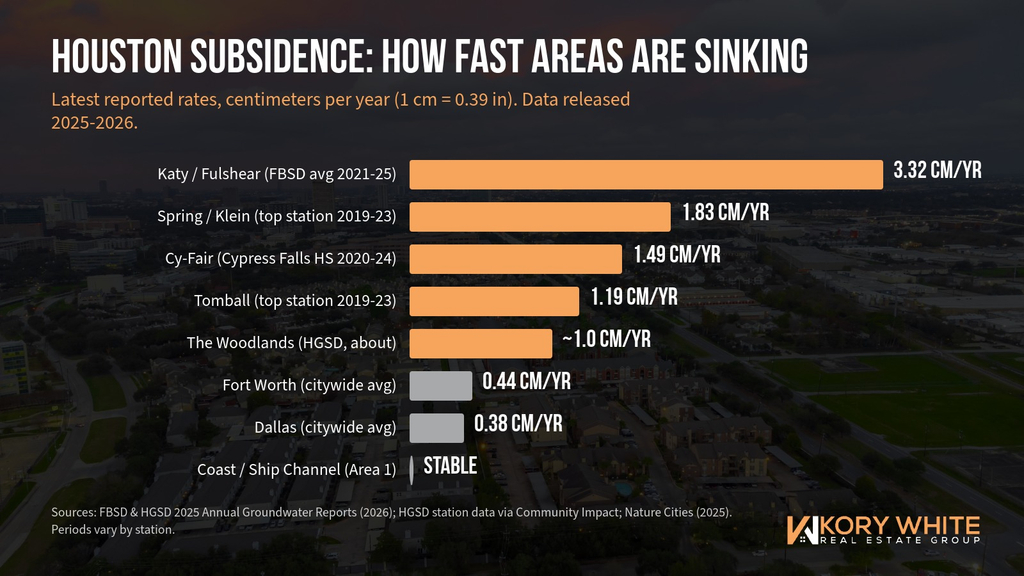
Alt text: Bar chart of Houston subsidence rates by area from the 2026 reports, with Katy and Fulshear highest
Katy and Fulshear: The Fastest-Sinking Area in Greater Houston
Katy and Fulshear have the highest measured subsidence rates in the region, about 3 centimeters (1.2 inches) or more per year at the worst stations.
Here is what the latest data and reporting show:
- One HGSD monitoring station in Katy recorded more than 14 inches of sinking between 2007 and 2025, according to KPRC 2’s May 2026 report.
- The Houston Chronicle reported that a sensor near Tamarron, a master-planned community between Katy and Fulshear, showed the ground dropping more than 3 centimeters per year, and more than 10 centimeters in about three and a half years.
- A Fulshear homeowner told KPRC 2 the ground by her curb now sits several inches lower than when she moved in.
Why Katy Is Sinking
The short answer: growth outpaced surface water. Katy, Fulshear and Cinco Ranch grew fast on groundwater wells. Meanwhile, surface water projects take years and billions of dollars to build.
The good news is that relief is in motion. The West Harris County Regional Water Authority’s Lake Houston pipeline, a project the Chronicle estimated at $1.2 billion or more, was expected online in mid-2026. On the Fort Bend side, the North Fort Bend Water Authority has until 2027 to meet its surface water requirement.
What It Means If You Buy in Katy or Fulshear
Katy is still one of the most popular places I help buyers in Houston, and I do not expect that to change. Even so, I want my buyers going in with eyes open:
- Expect water bills to rise. A water authority representative told Katy City Council that Lake Houston water will cost more than current groundwater. Those costs typically show up in water authority fees on your bill.
- Look hard at drainage. Subsidence can change how water flows across a lot or a street over time.
- Do not assume every crack is subsidence. Officials point out that clay soil and drainage cause plenty of foundation movement too, especially on former rice fields. That is exactly why an inspection matters.
👉 Search Homes in Katy, Fulshear and Nearby Communities
West Houston: Energy Corridor, Addicks and Jersey Village
West Houston sits in Regulatory Area 3, where groundwater is still a major source, so parts of it continue to sink, especially closer to the Katy and Cypress line.
West Houston has a long history here. For example, the USGS measured about 3.65 feet of sinking at its Addicks station over a 38-year study. In addition, a Jersey Village station showed about 28 inches of sinking over 26 years in HGSD data reported in 2021.
More recently, Jersey Village High School’s station logged about 7.9 centimeters (3.1 inches) since 2015, per HGSD data reported by Community Impact in 2025.
West Houston also has some of the area’s best-known fault lines, including the Long Point fault and the Addicks fault system. If you are shopping inside the Beltway on the west side, I covered how to check for faults in my guide to Houston fault lines.
👉 Search Homes in West Houston and Nearby Communities
Cypress and Cy-Fair
Cypress continues to sink at roughly 1 to 1.5 centimeters per year at many stations, with some long-term totals topping a foot.
Station data from HGSD, reported by Community Impact:
- Jarvis Road and Barker Cypress Road: 34.4 centimeters (13.5 inches) since 2000.
- FM 529 and Barker Cypress Road: 20.1 centimeters (7.9 inches) since 2007.
- Cypress Falls High School: 12.5 centimeters since 2015, at about 1.49 centimeters per year from 2020 to 2024.
Cy-Fair water providers are shifting to surface water through multimillion-dollar projects. In other words, the rates should slow as conversion happens, but they have not stopped yet.
👉 Search Homes in Cypress and Nearby Communities
Spring, Klein and Tomball
Spring and Klein saw about 0.76 to 1.83 centimeters of sinking per year from 2019 to 2023, and Tomball saw about 0.32 to 1.19 centimeters per year.
A few standout stations from HGSD data:
- North Bend Drive (Spring): 67 centimeters (26 inches) since 1994.
- Lindell Road near Southwell Park: 30.5 centimeters (12 inches) since 2007.
- Lee Road and Sweet Melody Lane (Tomball): 21 centimeters (8.3 inches) since 2007.
The USGS also estimated that Spring lost about 4.2 feet of elevation through 2021, most of it since 1987.
👉 Search Homes in Spring, Klein, Tomball and Nearby Communities
The Woodlands, Conroe and Montgomery County
Southern Montgomery County, including The Woodlands, has sunk about 2.5 feet through 2021, and the aquifer drop there is the largest in the region.
According to the USGS, subsidence through 2021 was about 2.5 feet in The Woodlands and about 1.5 feet in Conroe. Furthermore, HGSD’s 2026 report flags a groundwater level decline of more than 400 feet in south-central Montgomery County around The Woodlands.
Montgomery County is also where the politics get complicated. The county’s groundwater is regulated by the Lone Star Groundwater Conservation District, not a subsidence district. Over the years, local officials have openly disagreed about how much pumping is acceptable. Meanwhile, The Woodlands has used a blend of groundwater and Lake Conroe surface water since 2015 and 2016.
Montgomery County also has known fault lines, including the Big Barn fault through The Woodlands.
👉 Search Homes in The Woodlands, Conroe and Nearby Communities
Sugar Land, Richmond, Rosenberg and Fort Bend County
Most of Fort Bend County is sinking slowly compared with Katy and Fulshear, but the county still leans heavily on groundwater.
FBSD’s 2026 numbers show Sugar Land at about 33.1 centimeters since 1994 with slower recent rates, and Rosenberg at about 9.9 centimeters since 1999. Overall, Fort Bend used about 88.5 million gallons of groundwater per day in 2025, out of 212.1 million gallons of total demand.
FBSD requires a shift too. Area A must hold groundwater to 40% of demand by 2030, and Area B must hit the same mark by 2035. Therefore, expect continued water infrastructure spending, and possibly higher water rates, as conversion moves forward.
👉 Search Homes in Sugar Land, Richmond, Rosenberg and Nearby Communities
Baytown, Pasadena, Clear Lake and the Coast
The coast and Ship Channel areas, where Brownwood sank, are now considered stable because they converted to surface water decades ago.
HGSD’s 2026 report shows Area 1 with no significant subsidence. In fact, aquifer levels in Areas 1 and 2 have risen more than 200 feet since 1977. Areas near Galveston Bay and the Ship Channel took the worst historical hits, with up to 13 feet of sinking measured since 1906 in the lowest spots.
That history still matters for buyers. The ground did not bounce back, so the elevation those areas lost is gone for good. In short, flood risk on the coast comes more from that lost elevation, storms and sea level than from new sinking.
East and northeast of Houston, a 2022 University of Houston study also flagged higher subsidence rates around Channelview and Mont Belvieu.
👉 Search Homes in Baytown, Pasadena, Clear Lake and Nearby Communities
How Does Houston Compare With Dallas, Austin and San Antonio?
Houston is the fastest-sinking large city in the U.S., but Dallas, Fort Worth, Austin and San Antonio are sinking too.
A 2025 study in the journal Nature Cities looked at the 28 largest U.S. cities using satellite data from 2015 to 2021:
- Houston: more than 40% of the city is sinking more than 5 millimeters per year, 12% at double that rate, and some spots up to 5 centimeters (2 inches) per year.
- Fort Worth: about 4.4 millimeters per year on average.
- Dallas: about 3.8 millimeters per year on average.
- San Antonio: about 1.1 millimeters per year, but the study estimated 1 in 45 buildings faces high risk from uneven ground movement.
- Austin: about 1 in 71 buildings at high risk.
For North Texas buyers, the bigger day-to-day issue is usually expansive clay soil, not subsidence. Still, it is worth knowing the ground under DFW is moving too. I cover what is happening in both Houston and DFW on The Kory White Show.
👉 Search Homes in Dallas-Fort Worth, Austin, San Antonio and Nearby Communities
How Should Subsidence Affect Your Home Purchase?
Subsidence should not scare you off a whole area, but it should change your due diligence: check the subsidence map, flood history, drainage, faults, water costs and the foundation before you commit.
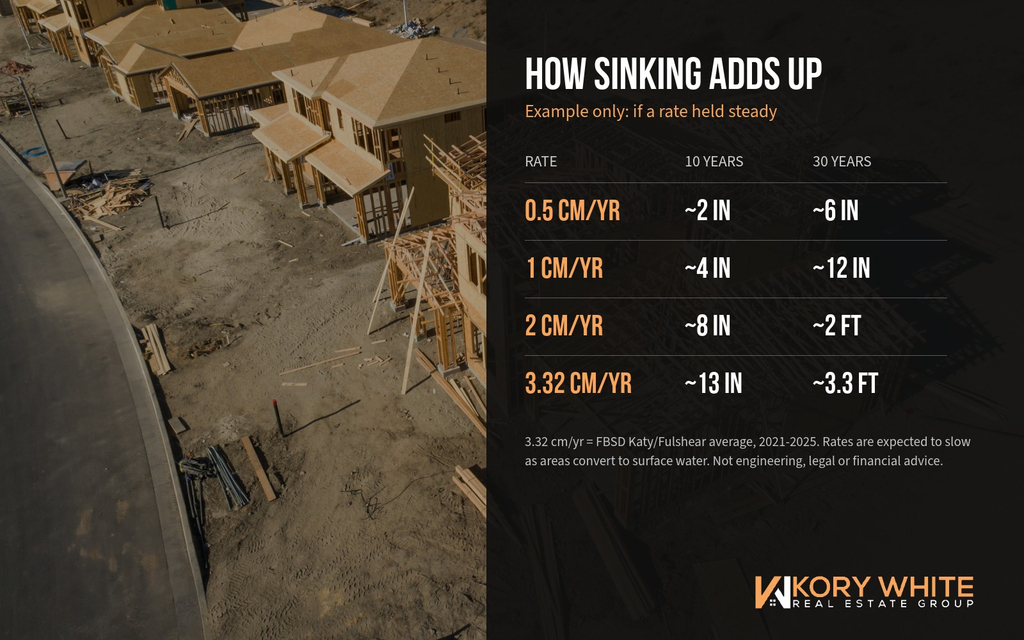
Alt text: Example table showing how different Houston subsidence rates add up over 10 and 30 years
Example: How Rates Add Up Over a Mortgage
These are examples only, assuming a rate stays the same. In reality, rates should slow as areas convert to surface water.Annual rateOver 10 yearsOver 30 years0.5 cm/yr (typical Area 3 floor)5 cm (about 2 in)15 cm (about 6 in)1 cm/yr (Woodlands, parts of Cypress)10 cm (about 4 in)30 cm (about 12 in)2 cm/yr (fast Spring and Katy stations)20 cm (about 8 in)60 cm (about 2 ft)3.32 cm/yr (Katy/Fulshear average, FBSD)33 cm (about 13 in)about 1 m (about 3.3 ft)
Uniform sinking across a whole area is not the main danger. Instead, the risk comes from uneven sinking, which tilts drainage, and from losing elevation in places that already flood.
Your Buyer Checklist
Before you write an offer in an area that is still subsiding:
- Check the official maps. Look up the nearest GPS station on the HGSD interactive subsidence map or the FBSD site.
- Pull the flood picture. Check the FEMA Flood Map Service Center, ask about flood history and read the seller’s disclosure closely.
- Price flood insurance anyway. Even outside a mapped flood zone, get a quote through FloodSmart before you are under contract. I explain insurance costs in my Texas homeowners insurance guide.
- Look for fault lines. Use the USGS principal faults map and my Houston fault lines guide.
- Inspect drainage and foundation. Ask your inspector to note grading, ponding and slab movement. If anything looks off, bring in a structural engineer during your option period.
- Ask about water costs. Find out which water authority and MUD serve the home and what their fees are. These are part of the hidden costs of buying in Texas.
[IMAGE PLACEMENT] File: houston-subsidence-buyer-seller-checklist.jpg
Alt text: Houston subsidence checklist for home buyers and sellers
If You Are Buying New Construction
New construction is where I see buyers skip this homework most. Builders in Katy, Fulshear, Cypress and Montgomery County are building on ground that is still settling, so ask:
- What is the community’s water source, and is the MUD part of a groundwater reduction plan?
- How was the lot graded, and where does water drain?
- Is the home in or near a mapped floodplain or a known fault?
Remember that the builder’s sales rep works for the builder. My guide on visiting a builder without your REALTOR®explains why that matters. If you are weighing options, my new construction vs. resale breakdown and Houston home builders guide are good next reads.
Price. Location. Build Type.
Most buyers can get 2 of 3. For instance, new construction in Katy or Fulshear at a lower price often means going farther out, where groundwater conversion is newer. On the other hand, resale closer in may sit in an area that converted years ago. Neither choice is automatically better. The right answer depends on the specific home, the lot and the numbers.
What Should Sellers Do?
Sellers in subsiding areas should get ahead of the questions: gather flood, drainage and foundation records, and disclose what you know.
Here is what I recommend:
- Collect your paperwork. Foundation repair warranties, engineer reports, drainage work and insurance claims all help.
- Fill out the seller’s disclosure carefully. The Texas seller’s disclosure asks about flooding and foundation issues. When in doubt, disclose.
- Fix drainage before listing. Standing water during showings costs more than the repair.
- Price with real comps. I have not seen data showing subsidence by itself lowers Houston-area prices. Still, buyers notice drainage and foundation problems, and those show up in offers.
Curious where your home stands? See what your home could be worth.
Is the Sinking Going to Stop?
In areas that switched to surface water, subsidence largely stopped, so the plan for Katy, Cypress, Spring and The Woodlands is to repeat that.
HGSD requires Area 3 water providers under a groundwater reduction plan to cut groundwater to 40% of demand by 2025 and 20% by 2035. As KPRC 2 reported in May 2026, HGSD is pushing Area 3 from about 40% groundwater today to 20% by 2035.
Big projects are already paying off. For example, the expanded Northeast Water Purification Plant in Humble now provides up to 400 million gallons of drinking water a day, up from about 80 million a few years ago.
As HGSD’s Turco put it: “Our intent, our job, is to prevent things like Baytown from happening in the future.”
The Bottom Line on Houston Subsidence
Brownwood shows what happens when the ground keeps dropping in a place that already floods. Fortunately, the coast learned that lesson, and it is stable today. Now, Katy, Fulshear, West Houston, Cypress, Spring and The Woodlands are working through the same conversion.
For buyers, that means one thing: do the homework. Look at the map, the flood history, the faults, the water bill and the foundation. Then buy with confidence.
If you want help reading the maps for a specific home, I am happy to walk through it with you.
📅 Schedule a Free 15-Minute Consultation
👉 Search Homes for Sale or Lease
📘 Download the Texas Home Buyer’s Guide
Frequently Asked Questions About Houston Subsidence
Which Houston suburb is sinking the fastest?
Katy and Fulshear have the fastest rates in the 2026 reports. FBSD measured an average of 3.32 centimeters per year at its Katy/Fulshear station from 2021 to 2025, and HGSD reported its highest rate, above 3 centimeters per year, in the same area.
Is West Houston sinking?
Yes, parts of it. West Houston is in HGSD Regulatory Area 3, where subsidence generally runs above 0.5 centimeters per year. Long-term stations at Addicks and Jersey Village have recorded feet and inches of sinking over the decades.
Is subsidence in Houston permanent?
Yes. Once clay layers compact, the land does not rebound. However, switching to surface water can slow or stop further sinking, as it did along the coast.
Does subsidence cause foundation problems?
It can contribute, mainly through uneven sinking and changes in drainage. That said, many Houston foundation issues come from expansive clay soil and drainage, so an inspection and, when needed, a structural engineer are the best way to know.
Does subsidence increase flood risk?
It can. Lower elevation and changed drainage can make flooding worse, which is exactly what happened in Brownwood. Check FEMA maps, flood history and an insurance quote before you buy.
How do I check subsidence for a specific address?
Use the interactive maps on the HGSD and FBSD websites to find the nearest GPS station and its rate. I also talk through local market questions like this on The Kory White Show.
Should I avoid buying in Katy because of subsidence?
Not necessarily. Katy is still a strong market with major surface water projects underway. Instead of avoiding it, check the specific home’s drainage, flood history, foundation and water costs.
Are Dallas and Fort Worth sinking too?
Yes, but more slowly. The 2025 Nature Cities study estimated about 3.8 millimeters per year for Dallas and 4.4 millimeters per year for Fort Worth on average.
About Kory White Real Estate Group
Kory White Real Estate Group helps buyers, sellers, investors and relocating clients throughout Texas, including Dallas-Fort Worth, Greater Houston, Austin, San Antonio and surrounding communities. We help with buying, selling, relocation, new construction, first-time buyers, luxury, investments and leasing.
We help clients understand the home, the numbers, the market and the deal.
Dallas: 469-336-3027 Houston: 281-738-4446 Website: korywhiterealestategroup.com
From Sugar Land to Sherman. From Manvel to Mansfield.
For agents: Clients in Katy and Cypress are going to ask you about this. I break down how to handle those conversations on Mentors + Masterminds = Escrows, and if you want coaching, systems and VA support behind your business, take a look at what I’m building with CoFounders.
Sources: Harris-Galveston Subsidence District 2025 Annual Groundwater Report (2026); Fort Bend Subsidence District 2025 Annual Groundwater Report (2026); KPRC 2 (May and September 2026); Houston Chronicle; Community Impact; U.S. Geological Survey; Ohenhen et al., Nature Cities (2025). Rates vary by station and period. This article is general information, not legal, engineering or financial advice.
Information About Brokerage Services (IABS) | TREC Consumer Protection Notice